- 1. Click Analytics Over Time: Tracking Your Link's Journey
- 2. Geographic Insights: Where Your Audience Clicks
- 3. Device Analytics: Mobile or Desktop?
- 4. Referrer Analysis: Who's Sending You Traffic?
- Putting It All Together
How Analytics work in Short Menu
Learn how to leverage short link analytics data for smarter marketing. Discover insights on clicks, geography, devices, and referrers to optimize your campaigns.
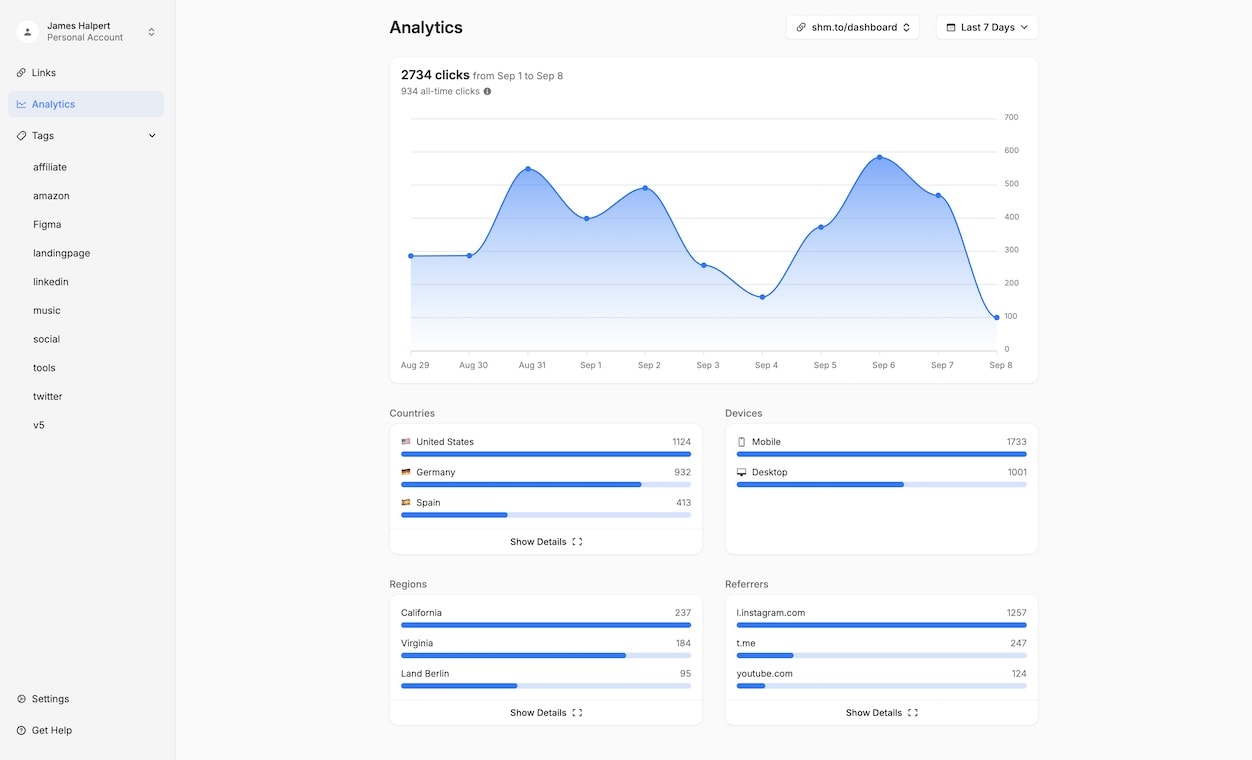 Your analytics dashboard provides a wealth of insights at a glance
In today's data-driven marketing landscape, understanding how your links perform is crucial. Our analytics feature empowers you to make informed decisions, optimize your campaigns, and maximize your reach. Let's explore the types of analytics data available and how you can leverage them to supercharge your marketing efforts.
1. Click Analytics Over Time: Tracking Your Link's Journey
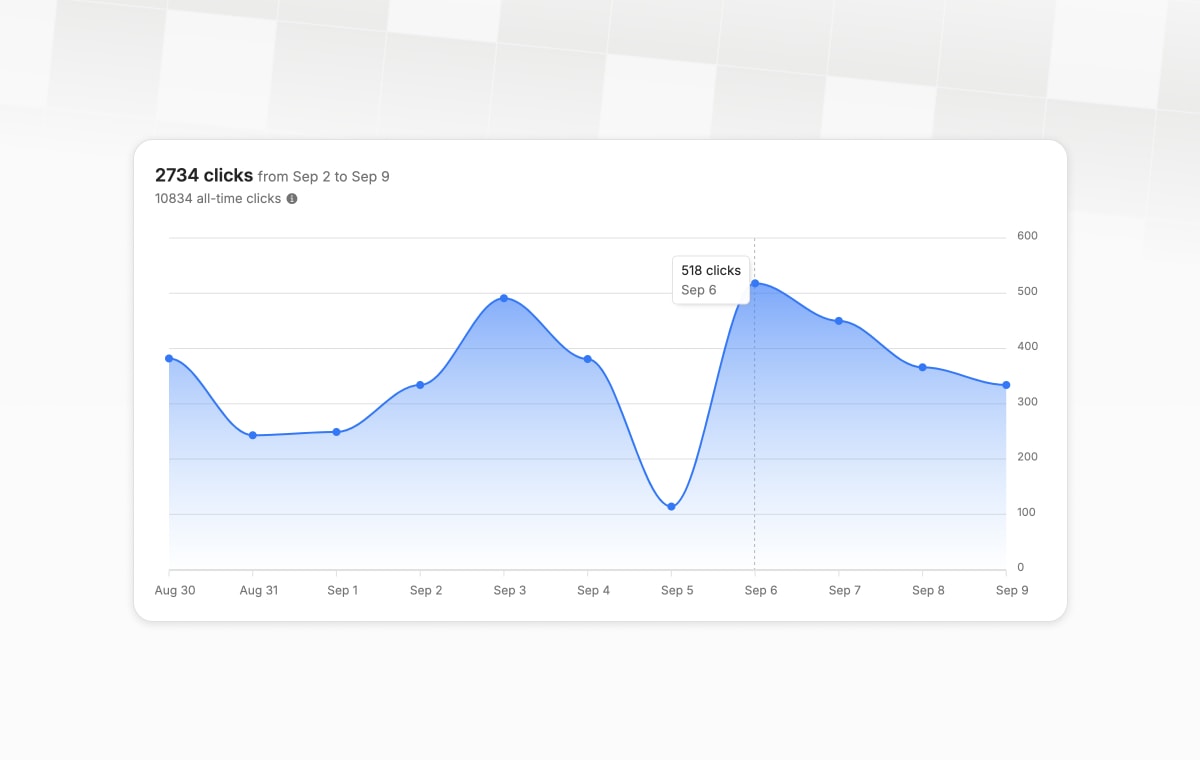 Visualize your link's performance over time
What it shows: A visual representation of your link's engagement over your selected timeframe.
Why it matters: This graph is your link's heartbeat. It shows you when your audience is most active and how your link performs over time.
How to use it: Identify peak periods of activity and correlate spikes with your marketing efforts. For instance, if you see a sudden uptick in clicks, ask yourself: Did you just launch a new campaign? Did your content go viral?
Pro Tip: Use the date range selector to zoom in on specific periods. This can help you isolate the impact of particular campaigns or events.
2. Geographic Insights: Where Your Audience Clicks
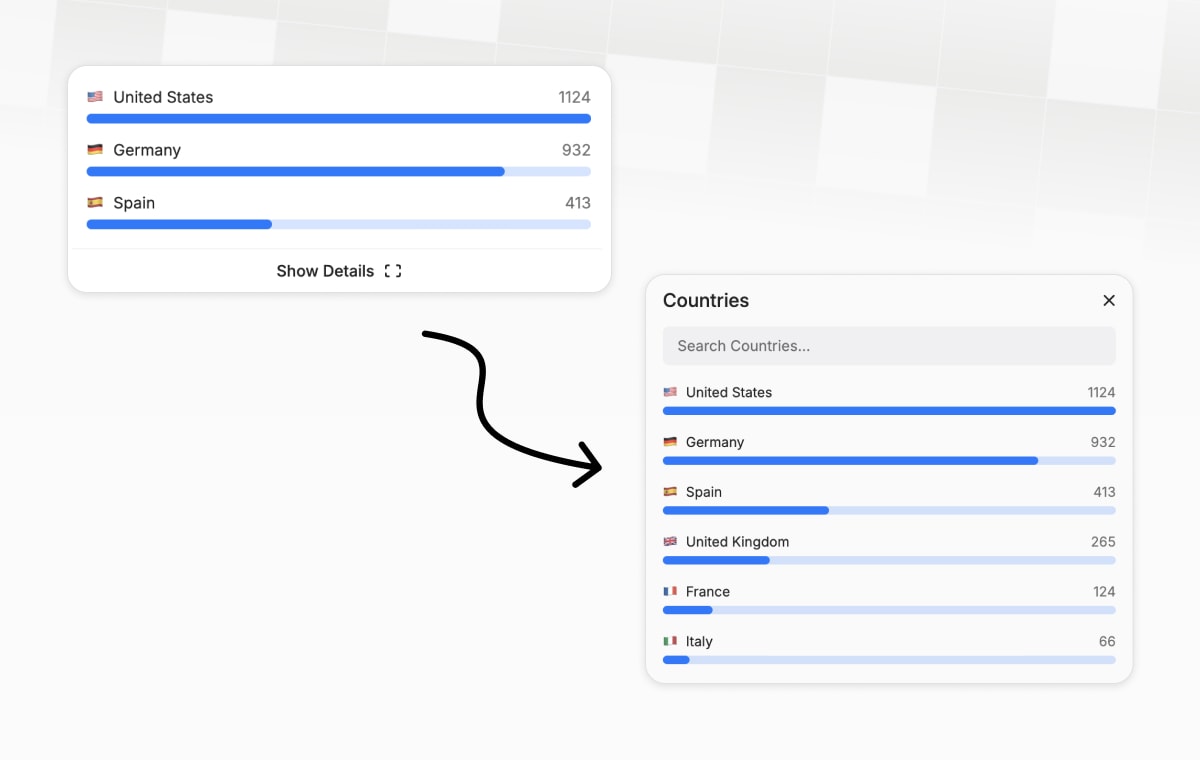 Understand where your audience is located
What it shows: A breakdown of link clicks by country and specific regions.
Why it matters: Knowing where your audience is located can inform your content strategy, help you tailor your offerings, and optimize ad spend.
How to use it: Click "Show Details" to expand beyond the top 3 countries or regions. Use this data to:
- Tailor content to specific markets
- Adjust advertising strategies for high-performing regions
- Identify unexpected pockets of engagement
Case Study: One of our users discovered unexpected traction in Germany for their English-language podcast. They created German subtitles and saw a 150% increase in German listeners within a month!
3. Device Analytics: Mobile or Desktop?
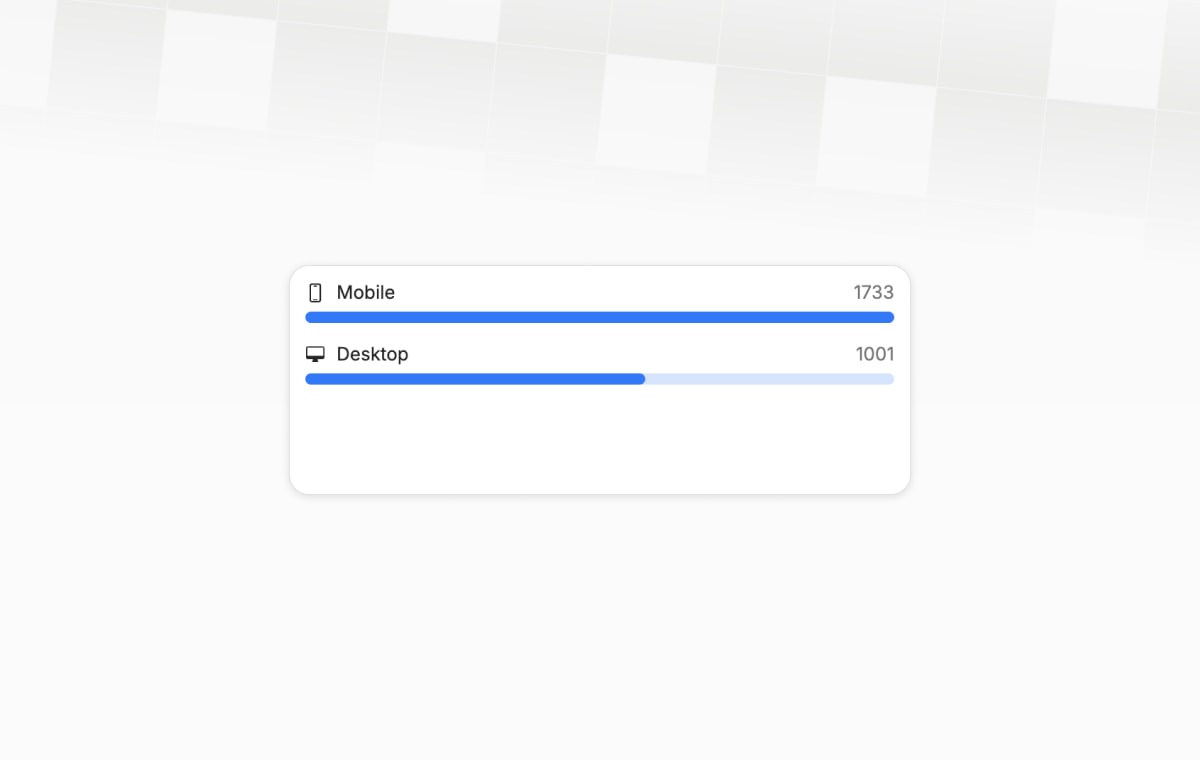 See how your audience accesses your content
What it shows: The split between mobile and desktop users clicking your links.
Why it matters: Understanding your audience's preferred devices helps you optimize your content and landing pages for the best user experience.
How to use it: If you see a heavy skew towards mobile, ensure your linked content is mobile-optimized. For desktop-heavy traffic, you might have more freedom with complex layouts or interactive elements.
Pro Tip: Use Short Menu's Mobile Redirect Link Add-Ons to redirect mobile users to a dedicated destination.
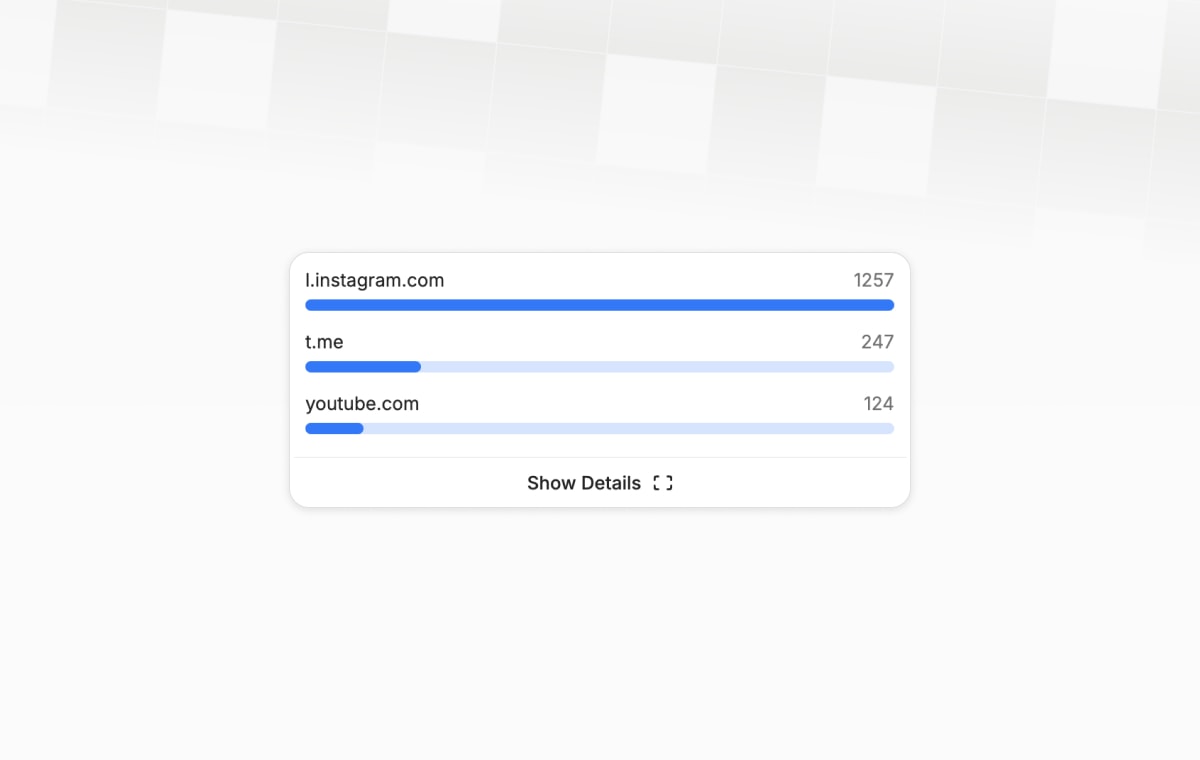
4. Referrer Analysis: Who's Sending You Traffic?
 Discover which platforms are driving traffic to your links
What it shows: The top sources sending traffic to your links.
Why it matters: This data helps you understand which channels are most effective and can reveal unexpected sources of traffic.
How to use it:
- Focus on high-performing channels
- Identify new partnership opportunities
- Adjust your content strategy based on where your audience is coming from
Quick Tip: Don't forget to click "Show Details" to see beyond the top 3 referrers. Sometimes, the most interesting insights are hiding just below the surface!
Putting It All Together
By combining insights from all these data points, you can create a comprehensive strategy that:
- Targets the right audience
- Delivers content at the optimal time
- Focuses on the most effective channels
- Provides the best user experience across devices
Remember, the key to success is not just collecting this data, but acting on it. Regularly review your analytics, test new strategies based on your insights, and always be ready to adapt.